

New tsunami map tool empowers Alaskans to plan for the worst
September 17, 2019
Fritz Freudenberger
907-474-7185
September is and, for many Alaskans, that means thinking about tsunamis.
With the most earthquakes and the longest coastline in the U.S., Alaska is the state most vulnerable to tsunamis. However, planning for natural disasters is difficult across a landscape peppered with communities only accessible by boat or seaplane.
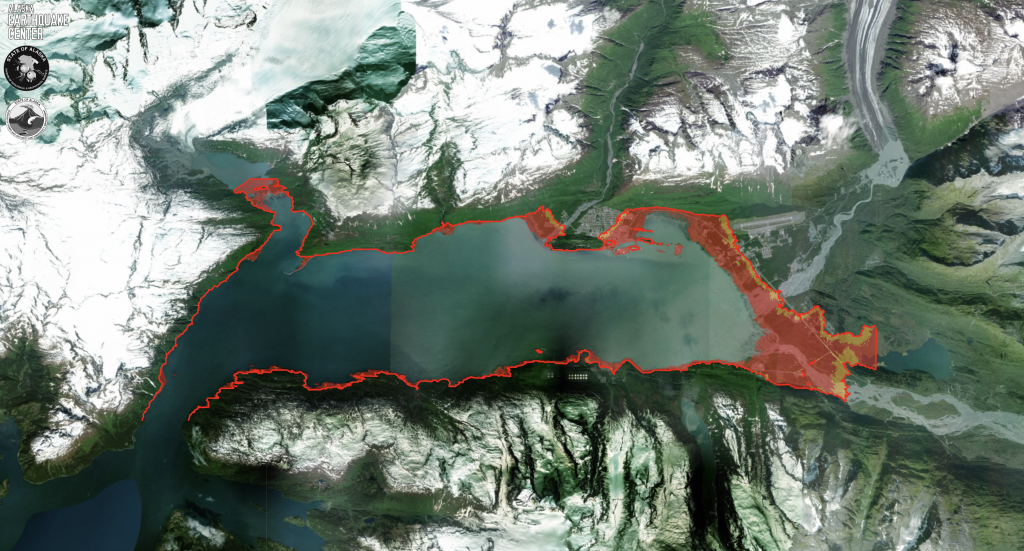
The Alaska Earthquake Center's new will help people plan for the worst. The tool, which went live this month, is an online map portal that displays potential tsunami hazard zones for settlements across Alaska.
“We have decades of top-notch research on what each community should, and should not, be worrying about in the next tsunami,” said Michael West, Alaska state seismologist and director of the earthquake center. “I am excited because this tool helps put that information in the palm of every Alaskan.”
Since 1998, the Alaska Earthquake Center, part of the University of Alaska Fairbanks Geophysical Institute, has been working in partnership with the Alaska Division of Geological and Geophysical Surveys and the Alaska Division of Homeland Security and Emergency Management to in coastal Alaska communities.
Maps were previously available as individual paper or digital documents, which could often be quite large. The new Alaska Tsunami Hazard Map Tool makes this information easier to access, especially for rural communities with limited internet connectivity.
‚ÄúThis is why I came to Alaska: to make something that actually helps people living in the danger zone,‚Äù said Elena Suleimani, a senior tsunami scientist ¬≠with the project, who came to Alaska from Russia in 1993 to pursue a Ph.D. in tsunami science at ∫⁄¡œ∫⁄¿˙ ∑. ‚ÄúFinally, we made something for John Smith living in Valdez.‚Äù
The production of tsunami maps involves several stages. First, researchers develop hypothetical tsunami scenarios and create computer model simulations for each. Then they compare the results with historical tsunami observations. Based on these, they are able to calculate the maximum likely extent of flooding.
The final result is a map that shows the possible extent of tsunami flooding, or inundation. The possible depth of the water on dry land, or flow depth, is also calculated when enough data for the community is available.
In total, 55 communities are included in the tool. They were selected based on factors such as tsunami hazard exposure, location, infrastructure and availability of data.
That is where these maps are most useful: to help communities plan.
Suleimani explained that residents of Alaska coastal communities need to evacuate as soon as they feel an earthquake. In Alaska, tsunamis generated by nearby earthquakes represent “near-field” hazards. In other words, people have minutes rather than hours to reach safety.
“What you need to do at 4 a.m. when the ground starts shaking, you need to grab your things and run uphill or wherever your community decided to go,” she said. “You shouldn't wait for officials to tell you what to do; you need to know in advance what to do. And these maps are what prepare you.”
The Alaska Earthquake Center helps communities decide, well before an emergency, where that safe place is and the best way to respond.
“This is the tool that allows households to develop their personal evacuation plans,” West said. “It empowers communities to come together and make informed decisions about how to plan for disaster.”
So, what’s next? Action.
“The inundation map is just the first step. Now we know the safe area,” Suleimani said. “Then we go to the community and we ask them, ‘Where will you put your shelter?’”
ADDITIONAL CONTACTS: Elena Suleimani, 907-474-7997, ensuleimani@alaska.edu and Dmitry Nicolsky, 907-474-7397, djnicolsky@alaska.edu.